
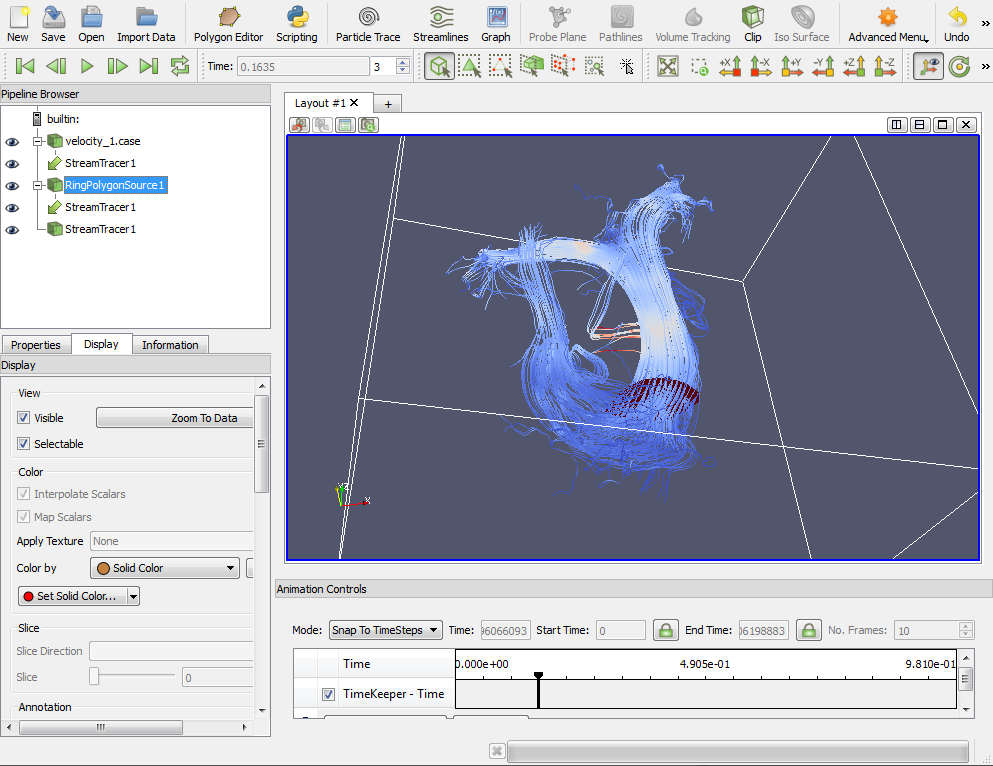
The above image shows the FourFlow GUI as it appears when one volume data set has been loaded, the volume can be seen as a white outline in the 3d view. The default state of the graphical interface of FourFlow consists of 6 sections:
FourFlow is an application for visualization and quantification of data from time-resolved three-directional phase contrast magnetic resonance velocity mapping (4D PC-MR). It is based on the Paraview software and has many similarities with it. The documentation for ParaView is complementary to the documentation for FourFlow and it is also distributed with FourFlow.
When we created FourFlow we envisioned a typical workflow as the user first having access to time resolved image data with velocity mapping in the Ensight Gold format and having an intention of visualizing this data in various ways. The recommended way of converting other types of data to the Ensight Gold format is with the FourFlow export plugin in the Segment software but the Ensight Gold format is well documented so it is possible to implement custom data exporters in other software. The next step after having the data in the right format is to import it into FourFlow and apply various visualization filters to it. It is at this point also possible to do some simple quantification.
Data to be imported into FourFlow must be in the Ensight Gold format. The .case files that are to be imported should all be in the same directory. The naming rules for the different files are as follows (the * character signifies that any string of characters are allowed here):
When importing data via the Import Data button on the main toolbar in the FourFlow GUI the user is presented with a folder browser dialog where the directory containing the data files is to be selected. When such a directory has been selected another dialog is shown where the user can select what files to import from that directory.
The above image shows the FourFlow GUI as it appears when one volume data set has been loaded, the volume can be seen as a white outline in the 3d view. The default state of the graphical interface of FourFlow consists of 6 sections:

The main toolbar has a number of different functions grouped together by type. Some of these functions are explained in more detail in other parts of this document.

The secondary toolbar has buttons for controlling animation playback, selection, view direction and orientation display. There is more detail on what these controls do in the ParaView documentation.

The pipeline browser shows the currently loaded data and the filters that are applied to that data. The eye icon to the left of the nodes control the visibility of that node in the currently active window. For example in the image of the pipeline browser that can be seen above we have a stack of images loaded in the 'sax_1.case' node and that node is connected to a node called 'SAX1', this node extracts and shows one slice of this image stack. A relationship between nodes is indicated by the existence of a '-' button next to the parent node that can be used to hide the child chain of nodes. Nodes can be renamed by selecting them and pressing the keyboard key F2. Nodes can be deleted by selecting them and pressing the 'delete' keyboard key.
The properties editor is split up into two different tabs.
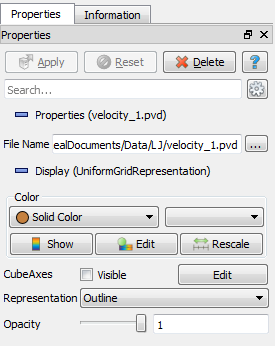
The properties tab is used to change node properties and for changing how the currently selected node is shown in the 3d view. In the following image it is displaying the settings for a volume node which has controls for changing what data to display and how to display it.
The information tab shows information about the data set in the currently selected node. It can show the extent of the data, what type of data it is, how many points or how much ram it takes up.


The animation controls are used to give a graphical indication of what the current timestep is. It can also be used to insert keyframes on properties for animation.

There are a couple of other windows as well in FourFlow, they are:

This window is used to select Ensight .case files from a specified directory.

The python script window is used to run and write python scripts.

The polygon editor window is used to create a 2d segmentation of a velocity volume.

A probe Plane is used to select an area in a volume for the Polygon Editor tool to place a polygon into. It shows a preview of the values surrounding the Probe plane on its surface.

To use a Probe Plane a volume containing velocity data must be selected in the Pipeline Browser. Clicking the Probe Plane icon in the main toolbar creates a Probe Plane in the middle of the volume. The Probe Plane is a square surface with coloration indicating the intensity or magnitude of the velocity data from the volume it is in.

A Probe Plane can be manipulated by clicking and dragging on the 4 different widgets on its surface that are visible when the Probe Plane is selected in the Pipeline Browser. These 4 widgets that can change the position, size and rotation of the Probe Plane are as follows:

When quantifying blood flow velocities, creating particle trace animations or pathlines a surface region is needed that can act as en emitter or as a measurement region. To create such a region the polygon editor tool in FourFlow is used.

Before launching the polygon editor it is recommended that a Probe Plane has already been created and positioned. The polygon editor is launched by clicking the 'Polygon Editor' button on the main toolbar. This splits the 3d view in two and shows the Polygon Editor as a window with a representation of the probe plane surrounded by several buttons. The following list describes what the buttons do.
To start creating a polygon simply left click in the probe plane visualization view and a vertex will be added, left click again and another vertex connected to the previous one will be added and so on. It is possible to select already added vertices by left clicking them and by holding down the left mouse button and dragging a selection rectangle over several vertices at once. A selected vertex or group of vertices can be moved around by left click-dragging them when the mouse cursor is over them. The polygon is always created in the current time frame, to get to the next time frame make sure the polygon editor window is the currently active window and use the keyboard arrow keys to go to the next or previous frames.
The image below shows the result of pressing the 'Create Polygon' button.


Particle tracing works in FourFlow by ejecting particles into a velocity volume from a polygon ring created via the polygon editor. The position of these particles are changed on every timestep based on the velocity data in the volume. The workflow for creating a particle trace visualization is as follows:

The attributes that can be changed on a particle trace node are the following:
Enables quantification of how many particles go through polygons (collectors) created with the polygon editor. Since it supports multiple polygons and shows the meassurements in a graph the results the difference in polygon throughput can be seen.
To create a particle collector graph first there must be a particle a particle trace simulation already set up. The particle collectors are created as normal polygons with the polygon editor on probe planes, there is no upper limit to how many are supported.
When clicking the Particle Collector button on the main toolbar there is a window that pops up asking for inputs and sources. The particle trace simulation node is the input and one or more polygons are the sources.
The resulting graphs show the number of vertices that the polygons have as an identification of what polygon matches to what graph line. To tell how many vertices a polygon has select it's node and switch to the Information tab, at the top there is a "Number of points:" field that tells how many there are.
Streamlines are very similar to particle tracing and works in FourFlow by ejecting particles into a velocity volume from a polygon ring created via the polygon editor. The lines in a streamline are created with the values in the velocity data volume at the current timeframe. The workflow for creating a streamline follows:

Pathlines are lines that connect the individual particles in a particle trace simulation, creating a visualization that looks similar to streamlines but unlike streamlines are calculated over the entire timestep range. To create pathlines first create a particle trace simulation and then click on the pathlines button.

Its possible to quantify the flow through a polygon created via the polygon editor in FourFlow with the Graph tool. The workflow to do this is as follows:
![]()
Volume Tracking is a method for tracking the flow of volumes over time, the workflow for using it is described below:
The volume tracking node includes widgets for changing the origin that the volume starts to get tracked from and also includes the ability to track volumes from both a plane and a sphere.

An isosurface is a surface constructed from a volume where the volume data is of the same value. For a velocity volume this means where the velocity has the same magnitude. To create such a surface select a velocity volume node and click the Isosurface button. The isosurface node has settings for changing what value in the velocity volume the surface gets created on.

A Vortex Core visualization shows the existence of vortex cores in a velocity volume. Since the actual calculation of the vortex cores cannot be done in FourFlow they must be done in another application (such as Segment). To show such a visualization import both a velocity volume (named velocity*.case) at the same time as importing a vortex core volume (named vortexprob*.case).
The scripting functionality in FourFlow uses the Python language. Please consult the ParaView documentation that ships with FourFlow for information about python scripting.

Sometimes it is desirable to change the light intensity of the objects that are displayed in the 3d view, for example the volume tracking visualizations tend to be a bit on the dark side by default. To do this, the scene light settings can be accessed via a small button on the active view toolbar. The int value of the key light tends to give a very bright appearance if set to about 1,7.
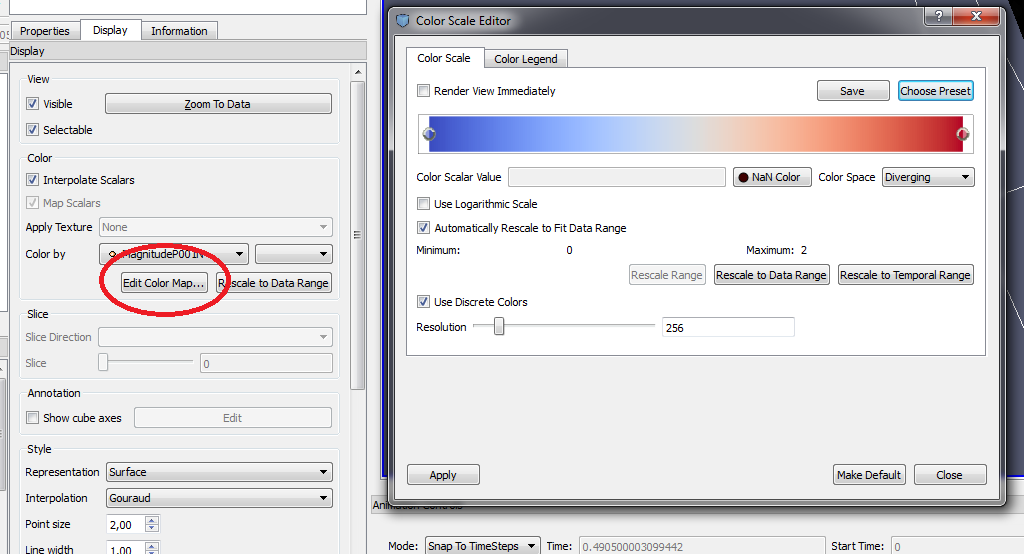
To access the colour editor in FourFlow first select the node that you want to change the color of in the node editor and then change the property editor to the display tab. Clicking the Edit Colour Map... button brings up the colour gradient editor.
Some visualizations can use up more ram then FourFlow allows itself to use causing animation calculations to become slow. To increase the ram available for use open up the Application Settings window from the Advanced menu and increase the Cache limit from the Animation menu item.

It is always best to store all the ensight (*.case) files in a search path that does not use strange characters. Doing so can cause FourFlow to throw up an error dialog stating something like: "Error parsing XML in stream at line 3622, column 52, byte index 186700: not well-formed (invalid token)" when loading a file that references *.case files in such a file path. If such an error has happened move the files to a better path and edit the FourFlow save file in a simple text editor (like notepad on windows) and change the file paths from the old one to the new one.